GoGoGraph Premium - Mastering the 7 Steps to Customize Your SAS Graphs
GoGoGraph is a two-day workshop that teaches how to customize graphs generated with proc sgplot, which can then be easily transposed to proc template.
Workshop
During this workshop, SAS biostatisticians and programmers put into practice the 7 steps of customization.
Step #1 – Creating a first version of your graph. Saving the graph as image.
Step #2 – Creating your own style template to customize your graph.
Step #3 – Adding some text, symbol, images near the bars. Customizing the bars (fill color, fill transparency; pattern type, pattern color; outline color, thickness and pattern type).
Step #4 – Customizing the axis.
Step #5 – Using the axis tables to add statistics near the graph.
Step #6 – Customizing the legend.
Step #7 – Using annotations (sganno=).
Onboarding
The workshop is preceded by two types of onboarding activities.
Activity 1: One OnBoarding Session
Gaol: Ensure that all logistical aspects are in place on the D-day
- One Online Session
- Duration 60 to 90-minute
Details
- During this session, you create the directories for the training, upload the files provided and adapt the paths in the SAS programs to your environment.
- At the end of this onboarding session, you take a quiz after running an initial SAS program and creating a first graph. You discover the SAS program structure in a fun and proactive way.
Activity 2: Email-Based Exercises
Goal: Ensure that all participants (regardless their background) are aware of the SAS syntax used during the workshop
- 5 exercises shared over a 1-week period
- Email-Based Solution
Topics:
- Dictionaries as alternative to proc contents
- Deleting user specific global macro variables
- Dealing with title style
- Dealing with line breaks
- Creating and using given formats.
Keep Learning after the Workshop
The workshop is followed by hand-on activities.
- 20 exercices shared over a 4-week period
- Email-based solution
Details:
- 5 exercicses to refresh workshop learnings.
- 15 guided exercises to gain experience with common specific situations.
xxformat Certificate
Criteria:
- Attend the full onboarding session with webcam on
- Answer the onboarding quiz
- Attend the workshop
Resources
At the end of the workshop, participants leave with training resources :
- Powerpoint: details of the 7 steps (30 to 40 slides per step, available online in PDF format)
- Playground: short examples illustrating specific options (SAS programs)
- Builder: access to snippet codes organized according to the 7 steps to build your graphics block by block (SAS programs)
- Portfolio: programs associated with the 20 portfolio graphics (SAS programs).
FAQ
How long last the workshop?
Face-to-Face Workshop
- 2 days
Online workshop
- 8 sessions of 2 hours each.
How many participants can attend the workshop?
Face-to-Face Workshop
- 4 to 8 participants
Online Workshop
- 4 participants
Target Audience
GoGoGraph Premium is designed for experienced SAS users i.e. both biostatistician and programmers.
Prerequisites
You must have your own SAS licence. If you choose to use SAS® Ondemand and/or if you are new to SAS® Studio, you will have access to the resources “How to quickly get started with SAS® Studio” to get used to the main features needed to create folders, upload/dowload files, reset a session, and so on.
When will be organised the next workshop?
For company specific workshop, sent your request to veronique.bourcier@xxformat.com
For cross-company face-to-face workshop:
- When : July 4th and 5th, 2026
- Where: Cologne, Germany
- Contact Person: veronique.bourcier@xxformat.com
How much does it cost?
Would you like to organize a workshop at your premises?
In addition to the baseline price for 4 participants, there is a fee for each additional participant and travel expenses.
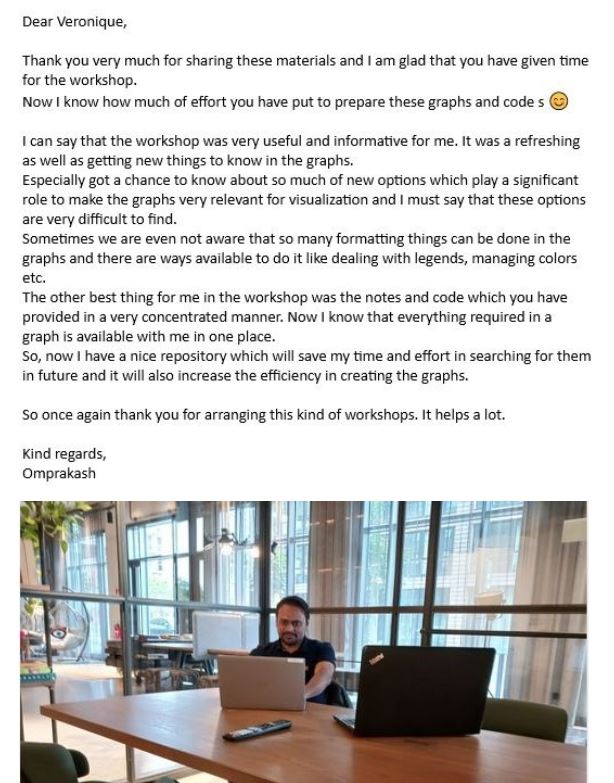
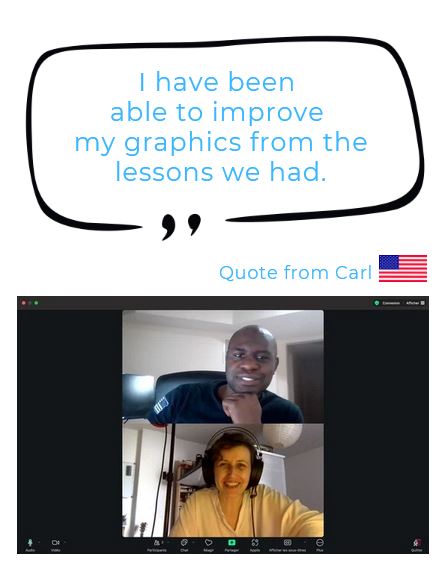
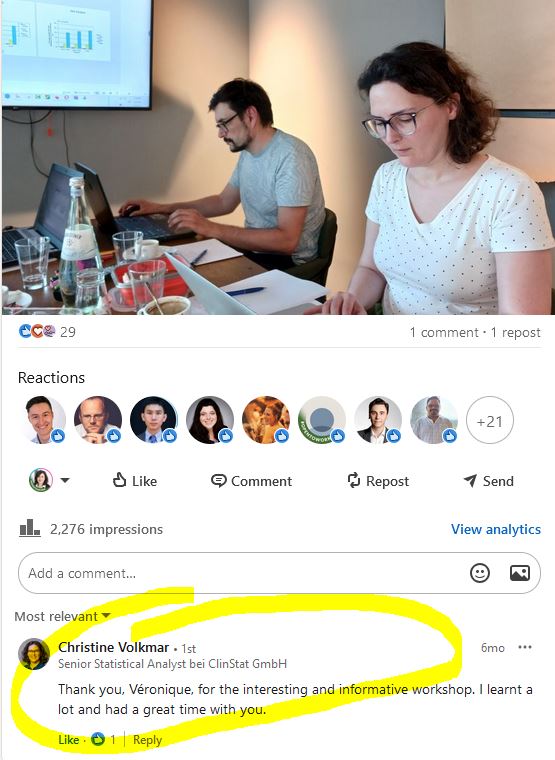
What people said about GoGoGraph Premium?